Blog 4: JDM Data Science: How to Use Site Statistics to Pick the Best Travel Dates
By Tom@TS Japan Tours
Use our Statistics and Calendar Page to take the guesswork out of travel. Identify peak seasons, predict recurring meets, and choose the best "home base" based on historical event density. Tracking the Flame icon trends ensures you book your trip during the most active weeks for Japanese car culture.
JDM Data Science: Using Site Statistics to Pick Your Perfect Travel Dates
When is the "best" time to visit Japan for car culture? Instead of guessing, we give you the data to decide.
The DISCOVER JDM Statistics and Calendar Page are powerful tools for the strategic traveler. By analyzing historical event density and regional trends, you can "data-mine" your way to the ultimate itinerary.
1. Planning with the Calendar Page
The Calendar Page is the most intuitive tool for making your planning easier. It allows you to visualize the density of events across your entire stay.
By seeing the full month at a glance, you can easily spot which weekends are "peak" and which are "quiet," allowing you to shift your travel dates or home base for maximum JDM exposure.
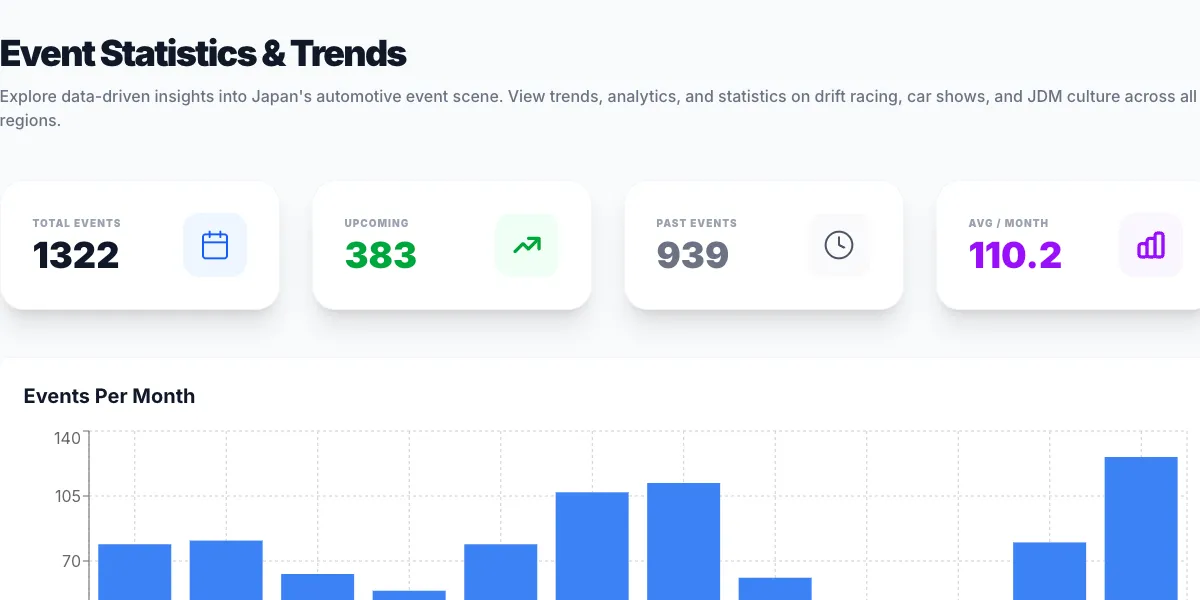
2. Identifying Peak Seasons
The "Events per Month" chart on our Statistics page is your starting point.
-
Spot the Peaks: Use the data to identify which months host the highest volume of events. For example, you might see a massive spike around January (Tokyo Auto Salon season) or May (Golden Week).
-
Avoiding the Lulls: If you are flexible, use the statistics to avoid months where event frequency dips, ensuring every weekend is packed with action.
3. Predictive Power
One of the biggest challenges for JDM travelers is that many organizers don't announce meets until 4 weeks prior.
-
The Strategy: Since many events are recurring or annual, looking at last year's data on the Statistics page allows you to predict what is likely to happen.
-
Booking with Confidence: If the data shows a region consistently has 20+ meets every October, you can book your flights with the confidence that the scene will be active.
4. Social Heat: Tracking the "I'm Going" Trends
By looking at which events are generating the most "I'm Going" (Flame icon) activity over time, you can gauge the overall health and popularity of different meet series.
The statistics help you see which types of events are trending upward, ensuring you stay at the cutting edge of the current scene.
Ready to crunch the numbers? Head over to our Statistics Page and start plotting your tour today!
Experience It With a Guide
Explore guided JDM tours and Japan car tour experiences led by bilingual local guides.
Browse JDM Tours